[패스트캠퍼스 수강 후기] 데이터전처리 100% 환급 챌린지 8 회차 미션 Programming/Python2020. 11. 9. 17:10
[파이썬을 활용한 데이터 전처리 Level UP- 8 회차 미션 시작]
* 복습
- 마스킹 검색, 문자열 검색, matplotlib 에 대한 기초 이론 등에 대해서 배웠었다. 특히, matplotlib 은 기초 이론만 습득을 했어고 아마도 오늘 실습을 통해서 자세히 알아 나갈 것 같다.
[01. Part 1) 데이터 핸들링 Chapter 06. 데이터 이쁘게 보기 - 데이터 시각화 - 02. 꺽은선 그래프 그리기]

// 산점도는 분포를 확인하기 용이한 그래프이다.
* matplotlib을 이용한 꺽은선 그래프 그리기
- pyplot.plot 함수를 사용하면 꺽은선 그래프를 그릴 수 있음
- 주요 입력
. x, y : x, y 축에 들어갈 값 (iterable 한 객체여야 하며, x[ i ] , y[ i ] 가 하나의 점이 되므로 길이가 같아야 한다.)
// series 등 점의 길이가 같아야 된다.
. linewidth : 선 두께
. marker : 마커 종류
. markersize : 마커 크기
. color : 선 색상
. linestyle : 선 스타일
. label : 범례
* Pandas 객체의 method를 이용한 꺽은선 그래프 그리기
- DataFrame.plot( ) 함수를 사용하면 DataFrame 을 사용한 그래프를 그릴 수 있다.
- 주요 입력
. kind : 그래프 종류 (‘line' 이면 선 그래프를 그림)
. x : x 축에 들어갈 컬럼명 (입력하지 않으면, index 가 x 축에 들어간다.)
. y : y 축에 들어갈 칼럼명 (목록)
. xticks, yticks 등도 설정이 가능함 (단, pyplot을 사용해서도 설정이 가능하다.)
* 실습

// 기본 환경 설정
// numpy 도 같이 불어옴
// magic keyword %matplotblib inline 을 통해서 cell 에서 그래프 표시
// Malgun Gothic => 보통은 윈도우 환경이다.
// cumsum 누적합이다.
// plt.xticks(xtick_range, df['날짜'].loc[xtick_range] x 축을 정의한다.
// DataFrame으로 직접 그래프 그리기는.. df.plot(kind='line', x='날짜', y = ['상품1, '상품2', '상품3'] 으로 설정하여 그릴 수가 있다.
// DafatFrame의 경우에는 훨씬 더 편하지만, 환경 설정등은 기본 환경을 이용해서 설정해줘야 한다.
// groupby 으로 그래프 그리기
// groupby , pivot 은 그래프를 그리기 위해서 많이 쓰이고 있다.
* matplotlib 을 이용한 산점도 그리기
- pyplot.scatter 함수를 사용하면 산점도를 그릴 수 있다.
- 주요 입력
. x, y: x, y 축에 들어갈 값 (iterable한 객체여야 하며, x[ i ], y[ i ] 가 하나의 점이 되므로 두 입력의 길이가 같아야 한다.
. marker : 마커 종류
. markersize : 마커 크기
. color : 마커 색상
. label : 범례
// 솔직히 matplotlib 함수에 대서는 자료가 굉장히 많이 있다.
// 아래는 matplotlib documentation 을 검색했을 때 나오는 공식 사이트
matplotlib.pyplot.plot(*args, scalex=True, scaley=True, data=None, **kwargs)// 기본적인 parameter 도 많이 있고.
Parameters:
| x, yarray-like or scalar
The horizontal / vertical coordinates of the data points. x values are optional and default to range(len(y)). Commonly, these parameters are 1D arrays. They can also be scalars, or two-dimensional (in that case, the columns represent separate data sets). These arguments cannot be passed as keywords. fmtstr, optionalA format string, e.g. 'ro' for red circles. See the Notes section for a full description of the format strings. Format strings are just an abbreviation for quickly setting basic line properties. All of these and more can also be controlled by keyword arguments. This argument cannot be passed as keyword. dataindexable object, optionalAn object with labelled data. If given, provide the label names to plot in x and y. Note Technically there's a slight ambiguity in calls where the second label is a valid fmt. plot('n', 'o', data=obj) could be plt(x, y) or plt(y, fmt). In such cases, the former interpretation is chosen, but a warning is issued. You may suppress the warning by adding an empty format string plot('n', 'o', '', data=obj). |
// 이외에도 다양한 paramter 값 들이 있다.
Other Parameters:
| scalex, scaleybool, default: True
These parameters determine if the view limits are adapted to the data limits. The values are passed on to autoscale_view. **kwargsLine2D properties, optionalkwargs are used to specify properties like a line label (for auto legends), linewidth, antialiasing, marker face color. Example:
If you make multiple lines with one plot call, the kwargs apply to all those lines. Here is a list of available Line2D properties: |
PropertyDescription
| agg_filter | a filter function, which takes a (m, n, 3) float array and a dpi value, and returns a (m, n, 3) array |
| alpha | float or None |
| animated | bool |
| antialiased or aa | bool |
| clip_box | Bbox |
| clip_on | bool |
| clip_path | Patch or (Path, Transform) or None |
| color or c | color |
| contains | unknown |
| dash_capstyle | {'butt', 'round', 'projecting'} |
| dash_joinstyle | {'miter', 'round', 'bevel'} |
| dashes | sequence of floats (on/off ink in points) or (None, None) |
| data | (2, N) array or two 1D arrays |
| drawstyle or ds | {'default', 'steps', 'steps-pre', 'steps-mid', 'steps-post'}, default: 'default' |
| figure | Figure |
| fillstyle | {'full', 'left', 'right', 'bottom', 'top', 'none'} |
| gid | str |
| in_layout | bool |
| label | object |
| linestyle or ls | {'-', '--', '-.', ':', '', (offset, on-off-seq), ...} |
| linewidth or lw | float |
| marker | marker style string, Path or MarkerStyle |
| markeredgecolor or mec | color |
| markeredgewidth or mew | float |
| markerfacecolor or mfc | color |
| markerfacecoloralt or mfcalt | color |
| markersize or ms | float |
| markevery | None or int or (int, int) or slice or List[int] or float or (float, float) or List[bool] |
| path_effects | AbstractPathEffect |
| picker | unknown |
| pickradius | float |
| rasterized | bool or None |
| sketch_params | (scale: float, length: float, randomness: float) |
| snap | bool or None |
| solid_capstyle | {'butt', 'round', 'projecting'} |
| solid_joinstyle | {'miter', 'round', 'bevel'} |
| transform | matplotlib.transforms.Transform |
| url | str |
| visible | bool |
| xdata | 1D array |
| ydata | 1D array |
| zorder | float |
// 상기와 같은 많은 기능들을 다 사용할 수는 없었지만, matplotlib 을 이용해서는 stock chart 를 나타내는 것에는 한계가 다분히 존재한다. 그래서 다른 candle stick 을 그릴 수 있는 plot 이 더 좋았고, 요즘에는 active chart 인 plotly 를 더욱 많이 사용하는 것 같다.
// mpl_finance
github.com/matplotlib/mplfinance
// candlestcik chart 그리기 좋은 라이브러리. pip install 을 통해서 설치 하면된다.
// 난 개인적으로 요즘 plotly 가 더 좋지만. ^^;;
[01. Part 1) 데이터 핸들링 Chapter 06. 데이터 이쁘게 보기 - 데이터 시각화 - 03. 산점도 그리기]
* Pandas 객체의 method 를 이용한 산점도 그리기
- DataFrame.plot( ) 함수를 사용하면 DataFrame을 사용한 그래프를 손쉽게 그릴 수 있으며, 산점도 역시 그릴 수 있다.
- 주요 입력
. kind : 그래프 종류 ( 'scatter'면 산점도를 그린다.)
. x : x 축에 들어갈 컬럼명 (입력하지 않으면, index 가 x 축에 들어간다.)
. y: y 축에 들어갈 컬럼명
. xticks. yticks 등도 설정이 가능하다. (단, pyplot 을 사용해서도 설정이 가능하다)
* 실습

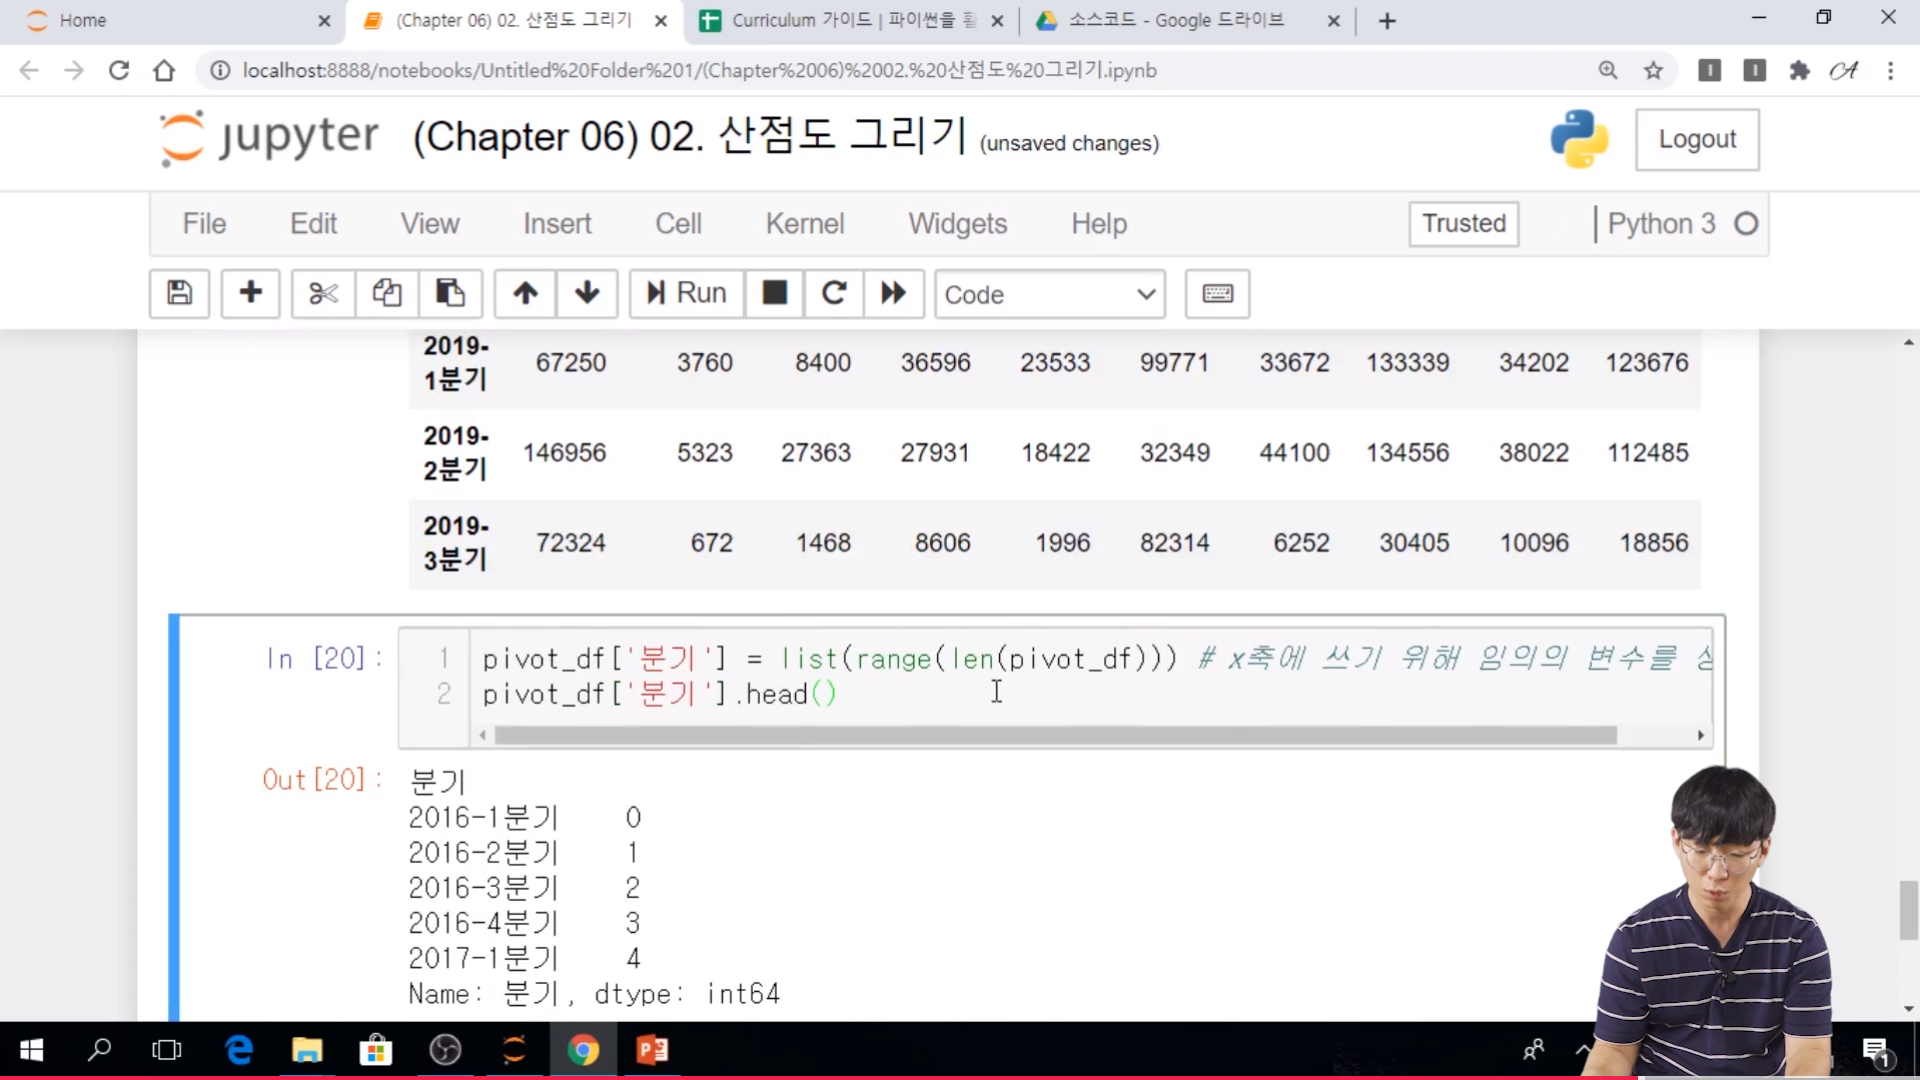
// 그래프를 그리는 것은 쉬운편이나, 그래프를 그리기 위해서 데이터를 어떤식으로 정제를 해야 하는지를 잘 알아야 한다.
// string access 를 통해서 하는가, 글씨 두개를 날리던가 하는 식으로 원하는 형태의 string을 얻을 수 있다.
// multiindex 는 . groupby 에서 list 형태 일때는 as_index 를 True로 두면된다. 약간 까다롭기 때문에 일반적으로 False로 두고 작업을 하는 것이 좋다.
// .unique( ) 를 통해서 각각의 리스트를 돌면서.. scatter 를 찍게 된다.
// Datafrme 을 이용해서 그리기
// .add_suffix 모든 것에 대해서 접미사를 붙이는 것이다.

// unique 한 갯수를 가지는 list 형태이다.
// df.plot 형태로 기본적인 plot의 형태를 찍어줬다.
// 산점도는 그래프를 그리는 것도 보다도 그래프를 그리기 위해서 데이터를 정리하는 시간이 더 오래 걸린다.
[01. Part 1) 데이터 핸들링 Chapter 06. 데이터 이쁘게 보기 - 데이터 시각화 - 04. 막대 차트 그리기]

* matplotlib 을 이용한 막대 차트 그리기
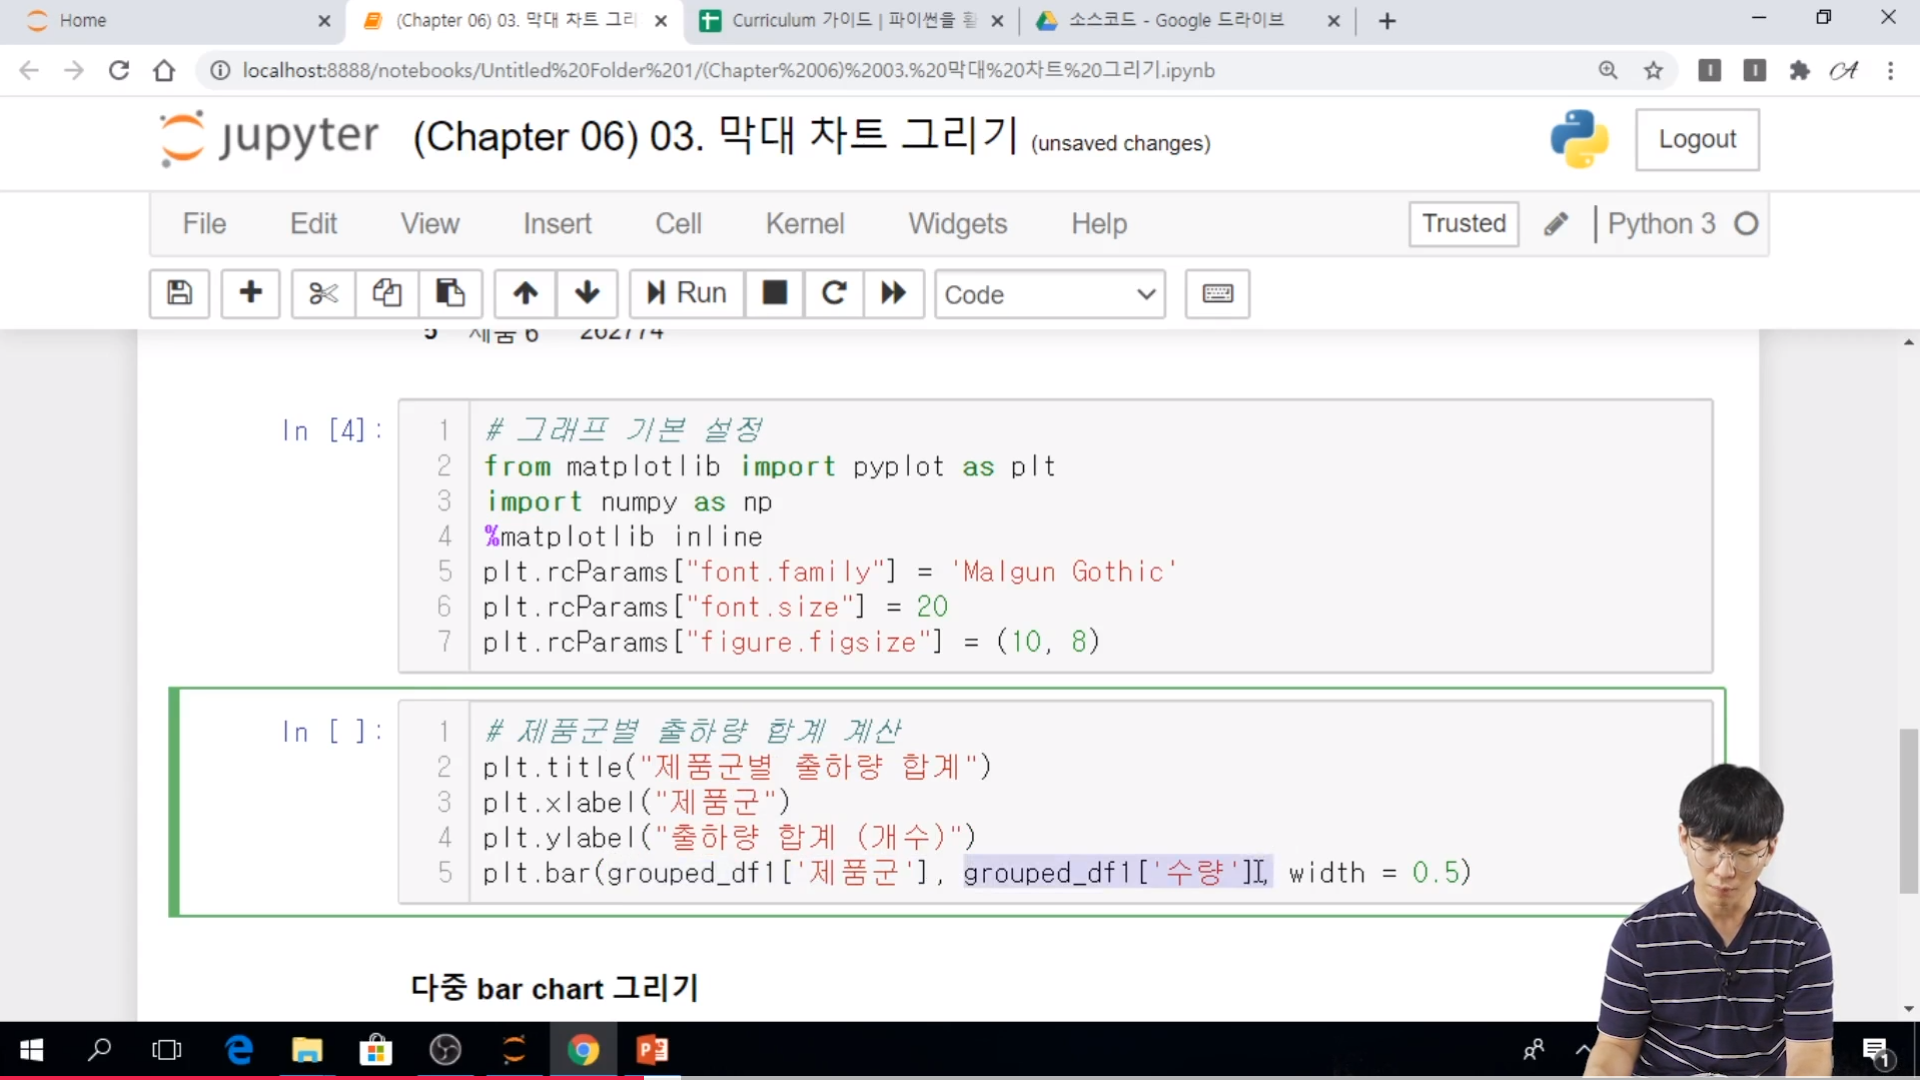
- pyplot.bar 함수를 사용하면 막대 차트를 그릴 수 있다.
- 주요 입력
. x : 막대의 위치
. height : 막대의 높이
. width : 막대의 너비
// 추후에는 width를 넓히는 것이 더 중요하는 것을 의미한다.
. align : 막대 정렬
* Pandas 객체의 method 를 이용한 막대 차트 그리기
- DataFrame.plot( ) 함수를 사용하면 DataFrame을 사용한 그래프를 손쉽게 그릴 수 있으며, 막대 차트 역시 그릴 수 있다.
- 주요입력
. kind: 그래프 종류 ('bar'면 막대 그래프를 그린다.)
. x: x축에 들어갈 컬럼명 (입력하지 않으면, index가 x축에 들어감)
. y : y 축에 들어갈 컬럼명 (목록)
. xticks, yticks 등도 설정이 가능하다. (단, pyplot 을 사용해서도 설정이 가능하다.)
* 실습

// x 에 문자를 넣게 되면 위치는 자동으로 0, 1, 2, 3, ~~~ 이런식으로 자동으로 잡히게 된다.

* 다중 막대 그래프 그리기
- 다중 막대그래프는 pandas의 groupby 혹은 set_index, 그리고 unstack, 혹은 pivot_table을 사용하면 쉽게 그릴 수 있다.
// 오른쪽과 같은 그래프가 다중 막대 그래프를 그리기 좋은 구조이다.
// pivot table 을 이용해서 만들면 되고, 만약에 안된다고 하면 groupby 를 사용해서 작업을 하면 된다.
* 실습

// groupby 이후에 unstack 을 하게 되면 pivot 형태를 가지게 되고 이를 그래프로 나타내면 된다.
[파이썬을 활용한 데이터 전처리 Level UP-Comment]
- matplotlib 을 이용한 그래프 그리그에 대해서 배워 볼 수 있었다. bar, line, scatter 등에서 배울 수 있었고 각각 DataFrame 을 사용해서 어떻게 작업을 해서 plot 을 그려야 할지에 대해서 알아봤다.
파이썬을 활용한 데이터 전처리 Level UP 올인원 패키지 Online. | 패스트캠퍼스
데이터 분석에 필요한 기초 전처리부터, 데이터의 품질 및 머신러닝 성능 향상을 위한 고급 스킬까지 완전 정복하는 데이터 전처리 트레이닝 온라인 강의입니다.
www.fastcampus.co.kr
'Programming > Python' 카테고리의 다른 글
| [패스트캠퍼스 수강 후기] 데이터전처리 100% 환급 챌린지 10회차 미션 (0) | 2020.11.11 |
|---|---|
| [패스트캠퍼스 수강 후기] 데이터전처리 100% 환급 챌린지 9 회차 미션 (0) | 2020.11.10 |
| [패스트캠퍼스 수강 후기] 데이터전처리 100% 환급 챌린지 7 회차 미션 (0) | 2020.11.08 |
| [패스트캠퍼스 수강 후기] 데이터전처리 100% 환급 챌린지 6 회차 미션 (0) | 2020.11.07 |
| [패스트캠퍼스 수강 후기] 데이터전처리 100% 환급 챌린지 5 회차 미션 (0) | 2020.11.06 |


