[패스트캠퍼스 수강 후기] 데이터전처리 100% 환급 챌린지 5 회차 미션 Programming/Python2020. 11. 6. 16:57
[파이썬을 활용한 데이터 전처리 Level UP- 5 회차 미션 시작]
* 복습
- read_csv, read_excel, to_csv, merge에 대해서 pandas의 간략한 기능들을 엿 볼 수 있었다.
[Chapter 04. 한 눈에 데이터 보기 - 데이터 통합 및 집계 - 02. concat을 이용한 데이터 통합]

* concat이 필요한 상황
- 센서, 로그, 거래 데이터 등과 같이 크기가 매우 큰 데이터는 시간과 ID 등에 따라 분할되어 저장된다.
- pandas.concat 함수를 사용하면 손쉽게 해결 할 수가 있다.
// 다시 말해서, 분할된 concat을 이용해서 손쉽게 정리 할 수 있다.
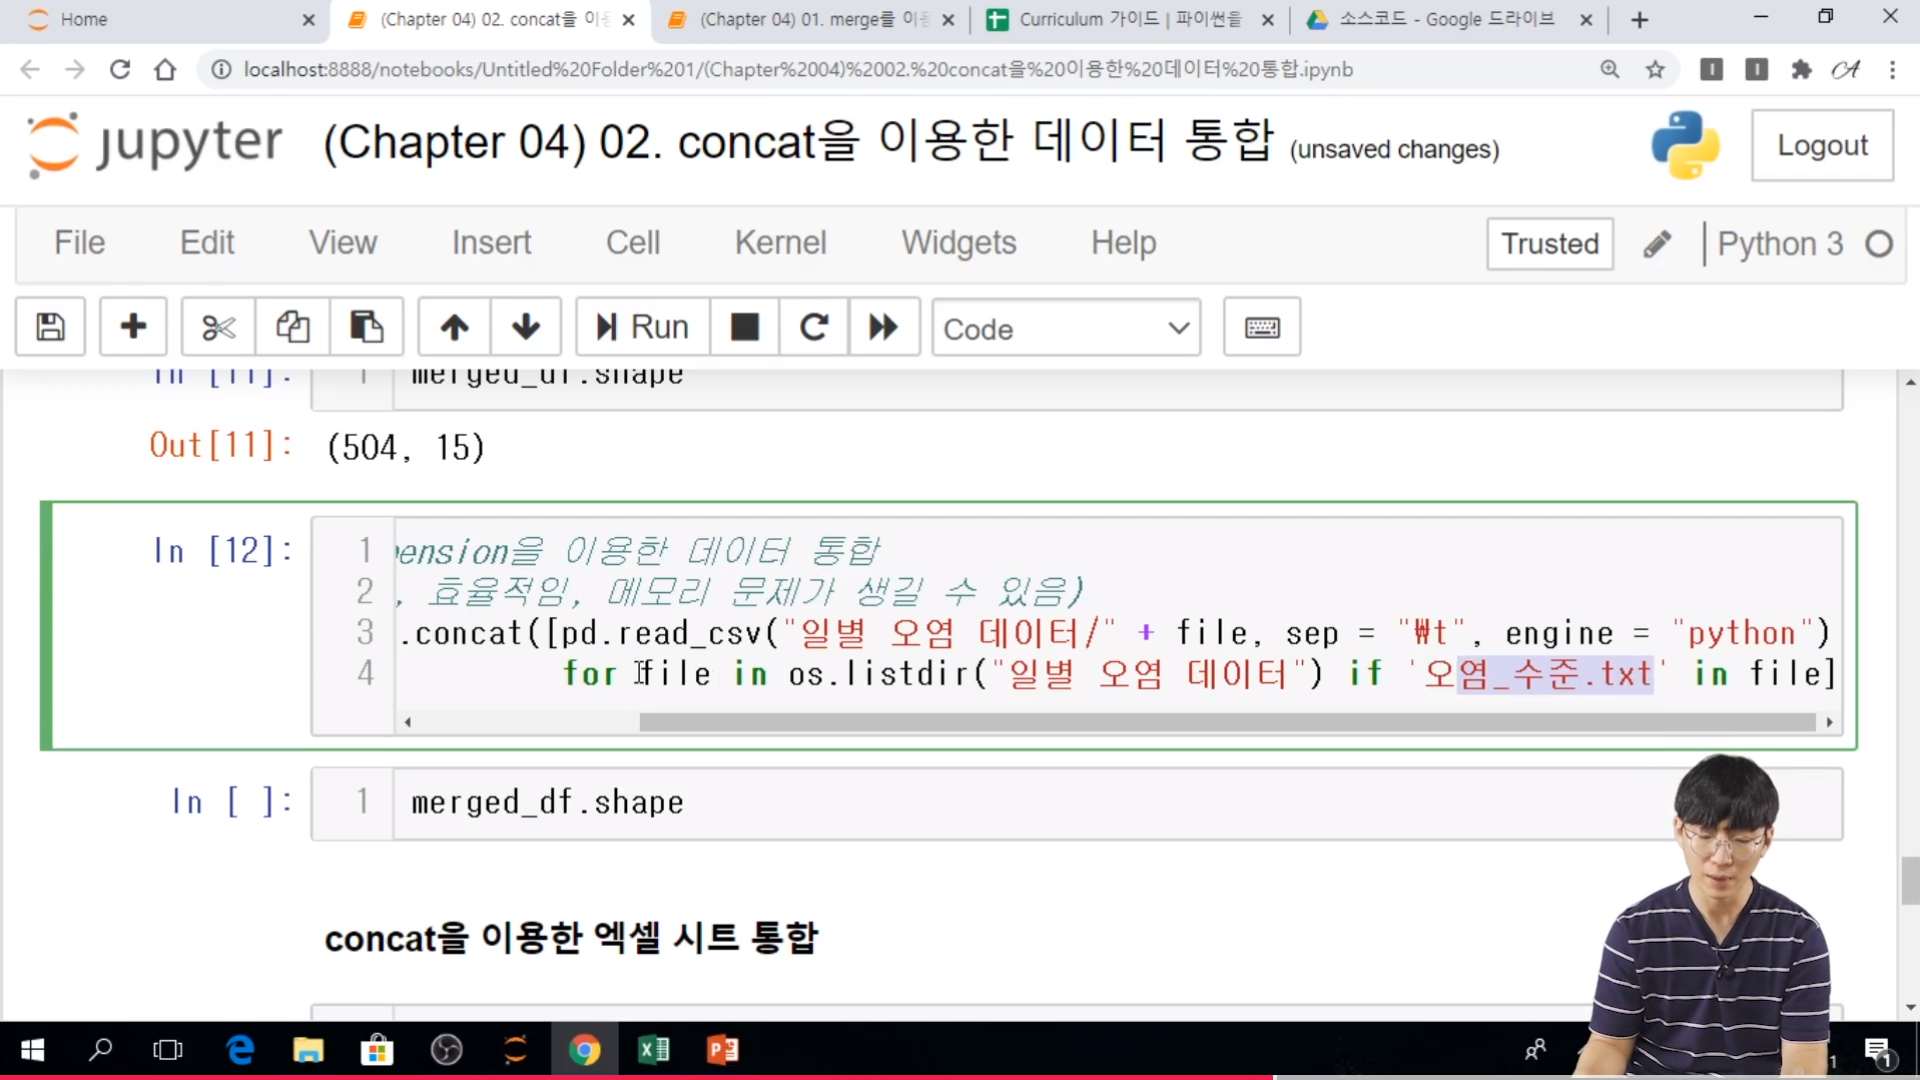
- 통합해야 하는 데이터가 많은 경우에는 빈 데이터프레임을 생성한 뒤, 이 데이터 프레임과 for문을 사용하여 불러온 데이터를 concat 함수를 이용하여 효율적으로 통합할 수 있다.
// concat 은 list 형태로 입력받아서 동시에 여러개를 입력 받을 수 있다는 것이 특징이다.

* pandas.concat
- 둘 이상으 데이터 프레임을 이어 붙이는데 사용하는 함수이다.
- 주요 입력 사항
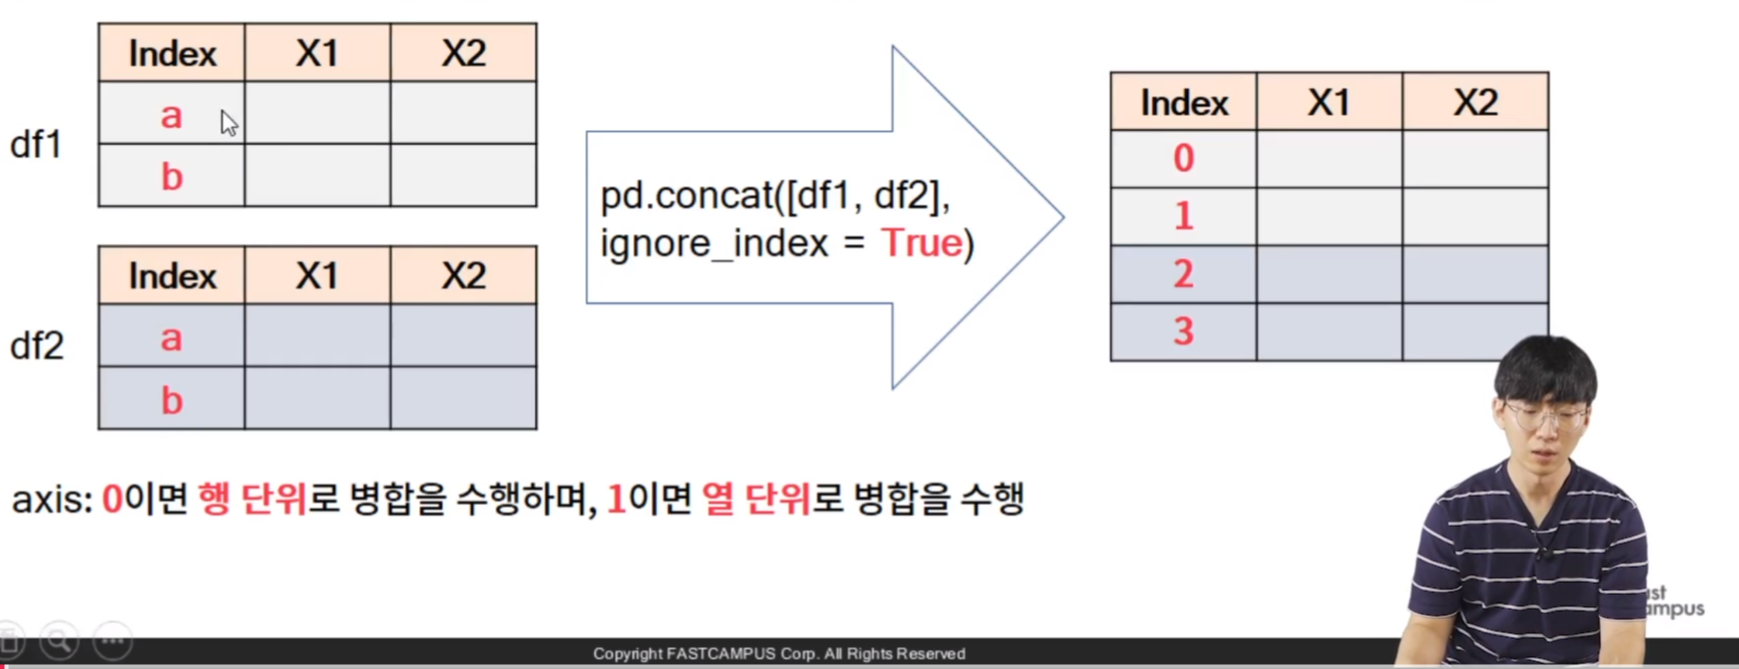
. objs -> DataFrame 을 요소로 하는 list (입력 예시: [df1, df2]) 로 입력 순서대로 병합이 된다.
. ignore_index -> True 면 기존 인덱스를 무시하고 새로운 인덱스를 부여하며, False 면 기존 인덱스를 사용한다는 것이다.
// ignore 는 행단위
. axis -> 0 이면 row 단위로 병합을 수행하며, 1 이면 column 단위로 병합을 수행한다.

* os.listdir
- os.listdir(path) -> path 상에 있는 모든 파일명을 리스트 형태로 반환한다.
// 다시 말해서, 파일명 들을 순회 하면서 list 형태로..

* xlrd를 이용한 엑셀 시트 목록 가져오기
- xlrd 는 엑셀 데이터를 다루기 위한 모듈로, 엑셀 내의 반복 작업을 하기 위해 주로 사용한다.
// 데이터 분석을 위해서는 잘 사용되지 않는 함수이다.
// wb.sheet. 시트 목록을 불러와서 반환해주기 때문에 이름을 효율적으로 사용할 수 있다.
* 실습

// column 의 경우에는 날리면서 0, 1, 2 가 자동으로 들어가기 때문에... column 형태 일때는 False로...
// 현재 dataframe.의 모양은 df.shape 으로 확인 가능
// for 문을 이용한 데이터 병합 (코드가 김, 상대적으로 비효율적임, 메모리 문제가 생길 가능성이 적음)
// 다시 말해서 상대적으로 쉬운 방법이라고 할 수 있다.

// list comprehension을 이용한 데이터 통합, 코드가 짧고, 효율적이지만, 메모리 문제가 생길 수 있음
// 하나의 리스트로 입력을 한다음에 concat으로 합치면 된다.
// 리스트상에 모든 데이터 프레임이 저장되어 있어야 되므로 메모리상에 문제가 된다.
// for 문은 하나가 돌고, 기존에 있던것은 삭제가 될 것이다. 하지만 list comprehension 은 계속해서 남아있어서 메모리 문제가 된다. 그래서 짧은 data는 list comprehension 으로 하는 것이 더 좋다.
// 엑셀에서 시트를 불러 오는 것은 sheetnames = wb.sheet_names( ) 을 통해서 리스트로 저장한다.
// pandas.concat 에 대한 documentation
pandas.pydata.org/pandas-docs/stable/reference/api/pandas.concat.html
pandas.concat(objs: Union[Iterable[‘DataFrame’], Mapping[Label, ‘DataFrame’]], axis='0', join: str = "'outer'", ignore_index: bool = 'False', keys='None', levels='None', names='None', verify_integrity: bool = 'False', sort: bool = 'False', copy: bool = 'True')-> DataFrame
pandas.concat(objs: Union[Iterable[FrameOrSeries], Mapping[Label, FrameOrSeries]], axis='0', join: str = "'outer'", ignore_index: bool = 'False', keys='None', levels='None', names='None', verify_integrity: bool = 'False', sort: bool = 'False', copy: bool = 'True')-> FrameOrSeriesUnion
//솔직히 위는 둘다 동일한 것 같다.
Parameters
objs a sequence or mapping of Series or DataFrame objects
If a mapping is passed, the sorted keys will be used as the keys argument, unless it is passed, in which case the values will be selected (see below). Any None objects will be dropped silently unless they are all None in which case a ValueError will be raised.
axis {0/’index’, 1/’columns’}, default 0
The axis to concatenate along.
// axis 는 default가 0 이다. 굳이 작성하지 않으면 row 형태로 밑으로 붙는 것이다.
[Chapter 04. 한 눈에 데이터 보기 - 데이터 통합 및 집계 - 03. 기초 통계 함수를 활용한 데이터 집계]

* 다양한 기초 통계 함수
- 기초 통계 함수는 DataFrame와 Series에 대해 모두 정의되어 있다.
. sum -> 합계 계산
. mean -> 평균 계산
. std -> 표준편차 계산
// std, standard devation
. var -> 분산 계산
. quantile -> 사분위수 계산
. min -> 최소값 계산
. max -> 최대값 계산
// dataframe, series 의 method 로 활용 할 수 있다.

* Tip. Axis 키워드
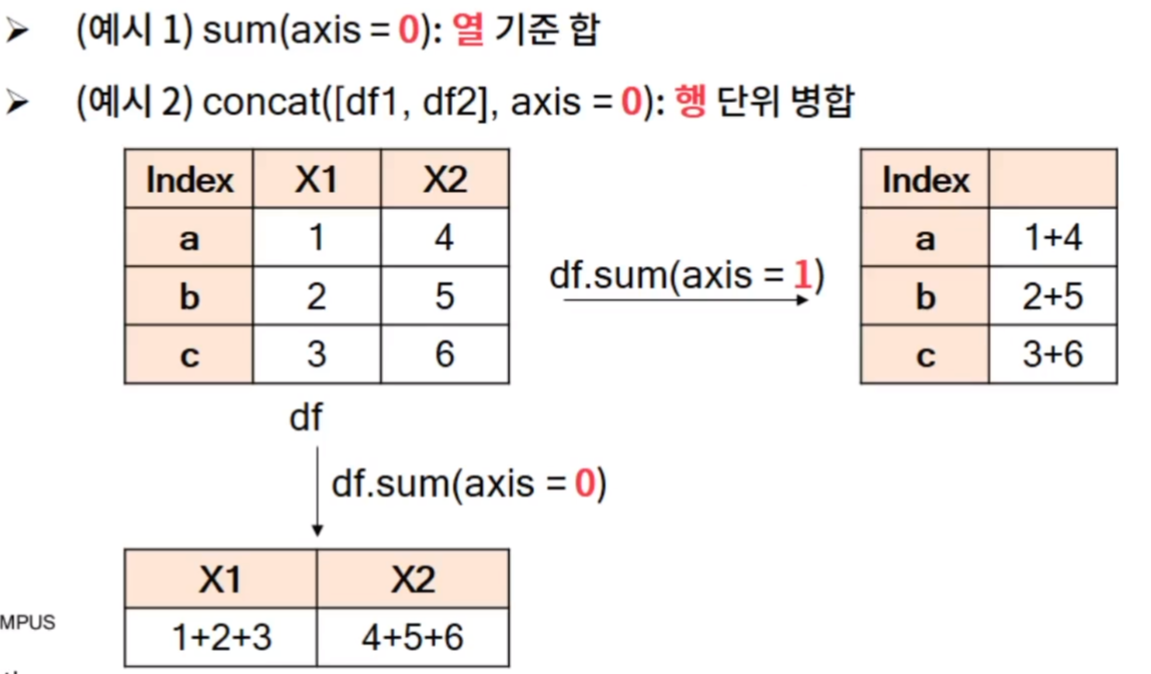
- axis 키워드는 numpy 및 pandas의 많은 함수에 사용되는 키워드로, 연산 등을 수행할 때 축의 방향을 결정하는 역할을 한다.
- axis 가 0 이면 row 을, 1 이면 column 을 나타내지만 이렇게만 기억하면 논리적으로 이상한 점이 존재한다.
// 대부분의 열 기준 합이라는 것은 row 끼리, column 끼리

// concat 함수가 대표적인 함수이다.
* describe 함수
- 열별로 대표적인 기초 통계를 반환 (count, mean, std, min 25%, 50%, 75%, max)
// count 는 결측치를 제외한 결과를 보여준다.
// quantile(0.1) 상위 10% 값을 나타내는 것이다. 상위 10%라는 것은 작은 값 기준 10%라는 것이다.
// 데이터분석을 할때 어느정도로 분포가 되어있는지를 확인할 때 describe( ) 를 사용한다.
// pandas.DataFrame.describe 에 대한 documentation
pandas.pydata.org/pandas-docs/stable/reference/api/pandas.DataFrame.describe.html
DataFrame.describe(percentiles=None, include=None, exclude=None, datetime_is_numeric=False)Generate descriptive statistics.
Descriptive statistics include those that summarize the central tendency, dispersion and shape of a dataset’s distribution, excluding NaN values.
Analyzes both numeric and object series, as well as DataFrame column sets of mixed data types. The output will vary depending on what is provided. Refer to the notes below for more detail.
// 결측치는 제외하고 값들을 보여 준다...
Parameters
percentileslist-like of numbers, optional
The percentiles to include in the output. All should fall between 0 and 1. The default is [.25, .5, .75], which returns the 25th, 50th, and 75th percentiles.
// 몇 번째에 해당하는지에 대한 사분위를 보여주는 것이다.
include‘all’, list-like of dtypes or None (default), optional
A white list of data types to include in the result. Ignored for Series. Here are the options:
-
‘all’ : All columns of the input will be included in the output.
-
A list-like of dtypes : Limits the results to the provided data types. To limit the result to numeric types submit numpy.number. To limit it instead to object columns submit the numpy.object data type. Strings can also be used in the style of select_dtypes (e.g. df.describe(include=['O'])). To select pandas categorical columns, use 'category'
-
None (default) : The result will include all numeric columns.
excludelist-like of dtypes or None (default), optional,
A black list of data types to omit from the result. Ignored for Series. Here are the options:
-
A list-like of dtypes : Excludes the provided data types from the result. To exclude numeric types submit numpy.number. To exclude object columns submit the data type numpy.object. Strings can also be used in the style of select_dtypes (e.g. df.describe(include=['O'])). To exclude pandas categorical columns, use 'category'
-
None (default) : The result will exclude nothing.
datetime_is_numericbool, default False
Whether to treat datetime dtypes as numeric. This affects statistics calculated for the column. For DataFrame input, this also controls whether datetime columns are included by default.
New in version 1.1.0.
[Chapter 04. 한 눈에 데이터 보기 - 데이터 통합 및 집계 - 04. pivot 을 이용한 데이터 집계]

* 피벗 테이블
- pivot table 은 데이터를 조건에 따른 변수들의 통계량을 요약한 테이블이다.
// 큰 데이터를 한 테이블로 나타낸다.
* pandas.pivot_table
- 주요 입력
. data -> 데이터 프레임
. index -> 행에 들어갈 조건
. columns -> 열에 들어갈 조건
. values -> 집계 대상 컬럼 목록
. aggfunc -> 집계 함수
* 실습
// index 제품, cloumns = , vlaues = , afffunc = 으로 ..하면 제품에 따른 것을 구하는 것이다.
// values 는 두개를 넣을 수도 있다. list 형태로 넣어야 된다.
// pandas.pivot_table 의 documentation
pandas.pydata.org/pandas-docs/stable/reference/api/pandas.pivot_table.html
pandas.pivot_table(data, values=None, index=None, columns=None, aggfunc='mean', fill_value=None, margins=False, dropna=True, margins_name='All', observed=False)// 각각의 parameter 들이 받을 수 있는 type 은 아래와 같다.
index column, Grouper, array, or list of the previous
columnscolumn, Grouper, array, or list of the previous
aggfuncfunction, list of functions, dict, default numpy.mean
// 몇 개의 Example
table = pd.pivot_table(df, values='D', index=['A', 'B'],
                    columns=['C'], aggfunc=np.sum)
table = pd.pivot_table(df, values='D', index=['A', 'B'],
columns=['C'], aggfunc=np.sum, fill_value=0)table = pd.pivot_table(df, values=['D', 'E'], index=['A', 'C'],
aggfunc={'D': np.mean,
'E': np.mean})table = pd.pivot_table(df, values=['D', 'E'], index=['A', 'C'],
aggfunc={'D': np.mean,
'E': [min, max, np.mean]})
[파이썬을 활용한 데이터 전처리 Level UP-Comment]
pivot table 도 전처리에서 많이 사용하는 것 같다. aggregation 의 다양한 형태들...
파이썬을 활용한 데이터 전처리 Level UP 올인원 패키지 Online. | 패스트캠퍼스
데이터 분석에 필요한 기초 전처리부터, 데이터의 품질 및 머신러닝 성능 향상을 위한 고급 스킬까지 완전 정복하는 데이터 전처리 트레이닝 온라인 강의입니다.
www.fastcampus.co.kr
'Programming > Python' 카테고리의 다른 글
| [패스트캠퍼스 수강 후기] 데이터전처리 100% 환급 챌린지 7 회차 미션 (0) | 2020.11.08 |
|---|---|
| [패스트캠퍼스 수강 후기] 데이터전처리 100% 환급 챌린지 6 회차 미션 (0) | 2020.11.07 |
| [패스트캠퍼스 수강 후기] 데이터전처리 100% 환급 챌린지 4 회차 미션 (0) | 2020.11.05 |
| [패스트캠퍼스 수강 후기] 데이터전처리 100% 환급 챌린지 3 회차 미션 (0) | 2020.11.04 |
| 주피터 노트북 폰트 변경 (0) | 2020.11.03 |


