일목균형표(Ichimoku Chart) 파이썬 코드(feat. chatGPT) Programming/Python2023. 2. 24. 21:43
안녕하세요.
오늘도 챗GPT와 함께 파이썬 코드를 만들어보았습니다.
주식 차트중 하나인 일목균형표입니다.
https://namu.wiki/w/%EC%9D%BC%EB%AA%A9%EA%B7%A0%ED%98%95%ED%91%9C
일목균형표 - 나무위키
전환선 (과거 9일간의 최고가+과거 9일간의 최저가)/2기준선(과거 26일간의 최고가+과거 26일간의 최저가)/2후행스팬금일 종가를 26일 전에 기입선행스팬1(금일 전환선값+금일 기준선값)/2, 이 수치
namu.wiki
일명 구름대라고 하는 곳을 벗어나는 주식이 좀더 강하다라는 이야기 인데 이걸 파이썬 코드로 한번 짜보겠습니다.
예전에는 이런것들을 일일이 구글링해서 운좋게 파이썬 코드가 있으면 복붙하면 되지만,
만약에 없었다면 수식을 보면서 일일이 만들어야 하는 수고로움이 있었죠.
하지만. chatGPT와 함께.ㅎㅎ 요즘 너무 친하게 지내는 것 같습니다.^^;;

짧은 영어실력임에도 영어로 질문하면 뭔가 조금더 정밀하게 대답을 해주는 것 같아서 영어로 진행해 보았습니다.
https://openai.com/blog/chatgpt/
ChatGPT: Optimizing Language Models for Dialogue
We’ve trained a model called ChatGPT which interacts in a conversational way. The dialogue format makes it possible for ChatGPT to answer followup questions, admit its mistakes, challenge incorrect premises, and reject inappropriate requests. ChatGPT is
openai.com
please make a Ichimoku Chart for stock in python
Sure, I can guide you through creating an Ichimoku Chart for a stock in Python. The Ichimoku Chart is a popular technical analysis tool that combines multiple indicators to provide a comprehensive view of a stock's price action.
To create an Ichimoku Chart, we need to calculate several indicators and plot them on a chart. The indicators we will use are:
Tenkan-sen (Conversion Line): This is the midpoint of the highest high and lowest low over the past 9 periods.Kijun-sen (Base Line): This is the midpoint of the highest high and lowest low over the past 26 periods.Senkou Span A (Leading Span A): This is the average of the Tenkan-sen and Kijun-sen plotted 26 periods ahead.Senkou Span B (Leading Span B): This is the midpoint of the highest high and lowest low over the past 52 periods, plotted 26 periods ahead.Chikou Span (Lagging Span): This is the current closing price plotted 26 periods behind.
Here is the Python code to calculate these indicators and plot the Ichimoku Chart for a stock:
import pandas as pd
import numpy as np
import matplotlib.pyplot as plt

# Load stock price data into a pandas dataframe
df = pd.read_csv('stock_price_data.csv')

# Calculate Tenkan-sen (Conversion Line)
period9_high = df['High'].rolling(window=9).max()
period9_low = df['Low'].rolling(window=9).min()
df['tenkan_sen'] = (period9_high + period9_low) / 2

# Calculate Kijun-sen (Base Line)
period26_high = df['High'].rolling(window=26).max()
period26_low = df['Low'].rolling(window=26).min()
df['kijun_sen'] = (period26_high + period26_low) / 2

# Calculate Senkou Span A (Leading Span A)
df['senkou_span_a'] = ((df['tenkan_sen'] + df['kijun_sen']) / 2).shift(26)

# Calculate Senkou Span B (Leading Span B)
period52_high = df['High'].rolling(window=52).max()
period52_low = df['Low'].rolling(window=52).min()
df['senkou_span_b'] = ((period52_high + period52_low) / 2).shift(26)

# Calculate Chikou Span (Lagging Span)
df['chikou_span'] = df['Close'].shift(-26)

# Plot the Ichimoku Chart
plt.figure(figsize=(12,8))
plt.plot(df['Date'], df['tenkan_sen'], color='red', label='Tenkan-sen')
plt.plot(df['Date'], df['kijun_sen'], color='blue', label='Kijun-sen')
plt.fill_between(df['Date'], df['senkou_span_a'], df['senkou_span_b'], where=df['senkou_span_a'] >= df['senkou_span_b'], color='green', alpha=0.2, label='Bullish Cloud')
plt.fill_between(df['Date'], df['senkou_span_a'], df['senkou_span_b'], where=df['senkou_span_a'] < df['senkou_span_b'], color='red', alpha=0.2, label='Bearish Cloud')
plt.plot(df['Date'], df['chikou_span'], color='purple', label='Chikou Span')
plt.plot(df['Date'], df['Close'], color
일목균형표에 대한 간략한 설명과 함께 코드를 리턴해주었습니다만!!!!!!!!!!!!!!!!!!!
짤렸네요.ㅋㅋㅋ
그래서 코드로 옮길시 제가 임의로 막 작성했어요.
import pandas as pd
import numpy as np
import matplotlib.pyplot as plt

# Load stock price data into a pandas dataframe
df = pd.read_csv('stock_price_data.csv')

# Calculate Tenkan-sen (Conversion Line)
period9_high = df['High'].rolling(window=9).max()
period9_low = df['Low'].rolling(window=9).min()
df['tenkan_sen'] = (period9_high + period9_low) / 2

# Calculate Kijun-sen (Base Line)
period26_high = df['High'].rolling(window=26).max()
period26_low = df['Low'].rolling(window=26).min()
df['kijun_sen'] = (period26_high + period26_low) / 2

# Calculate Senkou Span A (Leading Span A)
df['senkou_span_a'] = ((df['tenkan_sen'] + df['kijun_sen']) / 2).shift(26)

# Calculate Senkou Span B (Leading Span B)
period52_high = df['High'].rolling(window=52).max()
period52_low = df['Low'].rolling(window=52).min()
df['senkou_span_b'] = ((period52_high + period52_low) / 2).shift(26)

# Calculate Chikou Span (Lagging Span)
df['chikou_span'] = df['Close'].shift(-26)

# Plot the Ichimoku Chart
plt.figure(figsize=(12,8))
plt.plot(df['Date'], df['tenkan_sen'], color='red', label='Tenkan-sen')
plt.plot(df['Date'], df['kijun_sen'], color='blue', label='Kijun-sen')
plt.fill_between(df['Date'], df['senkou_span_a'], df['senkou_span_b'], where=df['senkou_span_a'] >= df['senkou_span_b'], color='green', alpha=0.2, label='Bullish Cloud')
plt.fill_between(df['Date'], df['senkou_span_a'], df['senkou_span_b'], where=df['senkou_span_a'] < df['senkou_span_b'], color='red', alpha=0.2, label='Bearish Cloud')
plt.plot(df['Date'], df['chikou_span'], color='purple', label='Chikou Span')
plt.plot(df['Date'], df['Close'], color='black', label='Close')
이렇게 짤린부분을 수습(?)을 하고 나서 실행을 해보았으나..에러가 나요~^^
전 그나마 얼마되지 않는 짬밥 좀 있다고 위에 리턴해준 코드를 보자마자 에러 날것을 알고 있었지만...
이런 문구를 보니 친절하지 않는 GPT에게 서운함이..ㅎㅎ

상단에 csv로 저장하는 부분. 즉 데이터가 있어야 합니다.
역시나 엄청 친절하지는 않는 GPT아조씨..ㅋ
걍 제가 작성해도 되지만..
그래도 다시 한번 물어봤습니다.
how to get the stock_price_data.csv
솔직히 기대를 안하고 물어봤는데...
To get the 'stock_price_data.csv' file, you can use a financial data API or a web scraper to retrieve the historical stock price data for the desired stock. Here's an example of how to use the 'yfinance' library in Python to download historical stock price data:
import yfinance as yf

# Set the stock ticker symbol and the date range
ticker = 'AAPL'
start_date = '2020-01-01'
end_date = '2022-02-24'

# Download the historical stock price data using yfinance
data = yf.download(ticker, start=start_date, end=end_date)

# Save the data to a CSV file
data.to_csv('stock_price_data.csv')
This code will download the historical stock price data for Apple (AAPL) from January 1, 2020 to February 24, 2022 and save it to a CSV file named stock_price_data.csv in the current directory. You can modify the code to download the data for a different stock and date range by changing the ticker, start_date, and end_date variables.
예상외로..간략한 사용법과 함께 yfinance 라이브러리로 실행하는 방법을 알려줍니다.
전 구글코랩을 자주 이용하기 때문에 yfinance가 설치가 안되어 있어서 에러가 날줄? 알지만. 걍 복붙 해봅니다.ㅎ
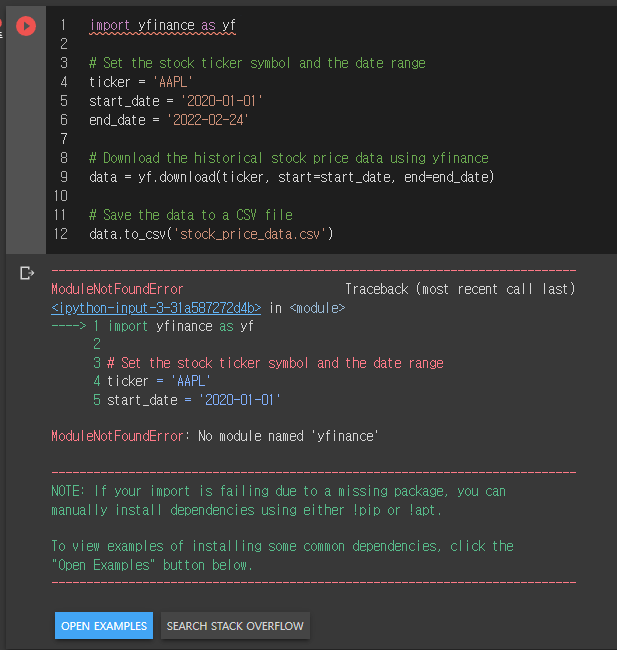
역시나 ' No module named 'yfinance' 를 뱉어내는 군요^^
그래서!!!!!!! 또 물어봤습니다.

how to install yfinance library in python.
(너무나 정직한(?) 저의 검소한 영어 실력.ㅋ)
To install the yfinance library in Python, you can use pip, which is a package manager for Python. Here are the steps to install yfinance:
1. Open a terminal or command prompt.
2. Type pip install yfinance and press Enter.
3. Wait for pip to download and install the yfinance library and its dependencies.
Here's an example of how to use yfinance to download historical stock price data:
import yfinance as yf

# Set the stock ticker symbol and the date range
ticker = 'AAPL'
start_date = '2020-01-01'
end_date = '2022-02-24'

# Download the historical stock price data using yfinance
data = yf.download(ticker, start=start_date, end=end_date)

# Print the data to the console
print(data)
This code will download the historical stock price data for Apple (AAPL) from January 1, 2020 to February 24, 2022 and print it to the console. You can modify the code to download the data for a different stock and date range by changing the ticker, start_date, and end_date variables.
오.. 친절하게 알려줍니다.
그래서 설치
!pip install yfinance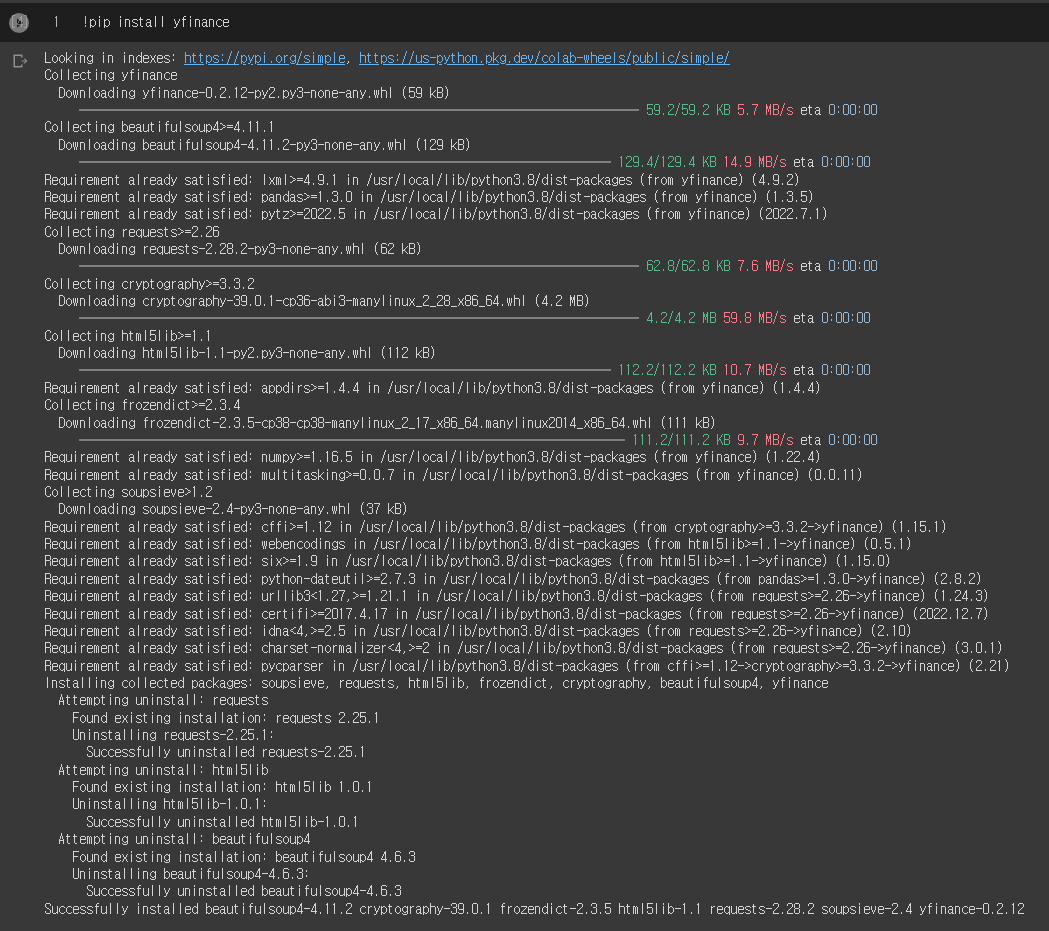
설치후 다시 재실행

다시 stock_price_data.csv 를 로딩하고,

코드실행..두근두근..
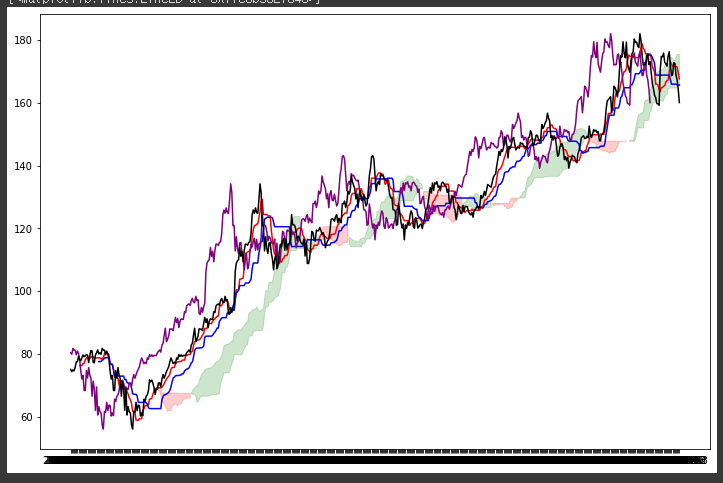

오...만들어지네요.ㅋ
이게 정확한지는 모르겠지만, 무료의 한계인가요? 짤린 코드 뒤가 궁금하지만. 여기까지 해보았구요.
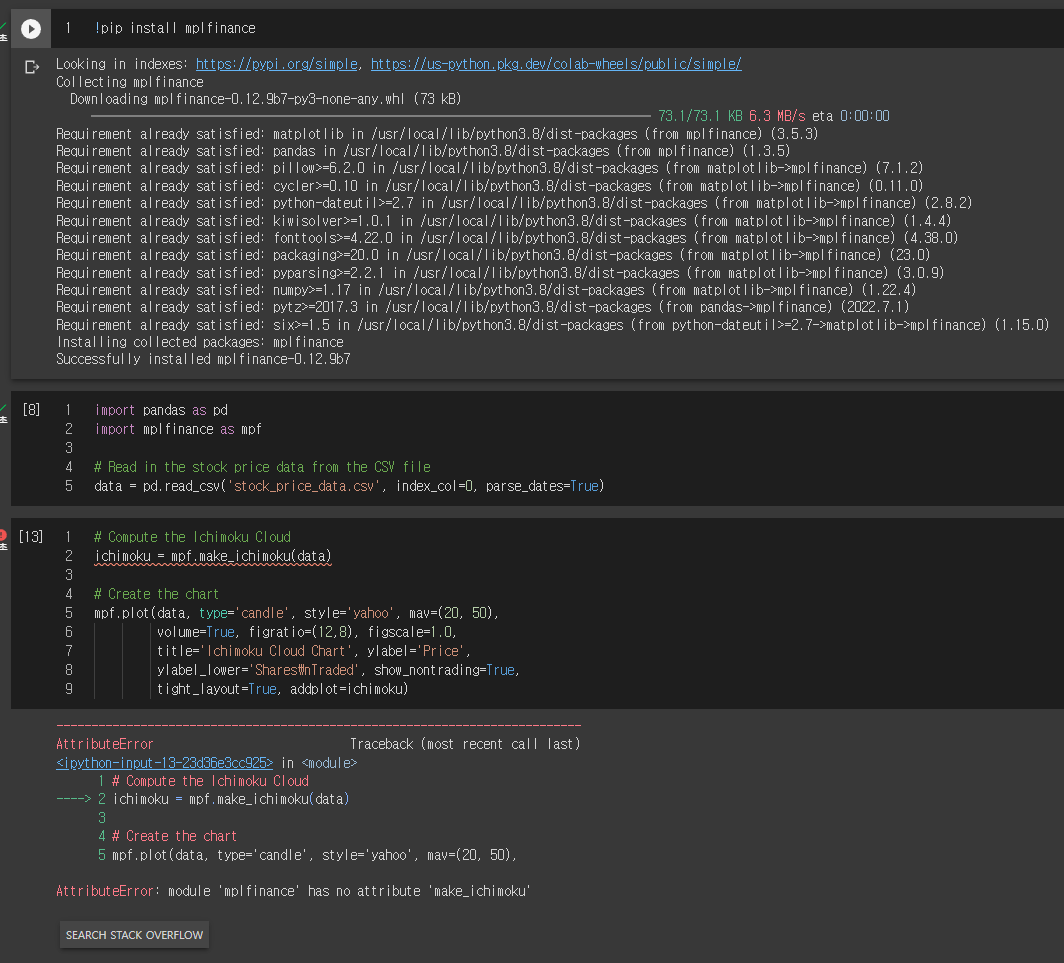
역시나 오늘도 느끼는 거지만 질문을 잘 던져야 한다는 것 같아요. 그래서 좀더 구체적인 질문을 해보았어요.
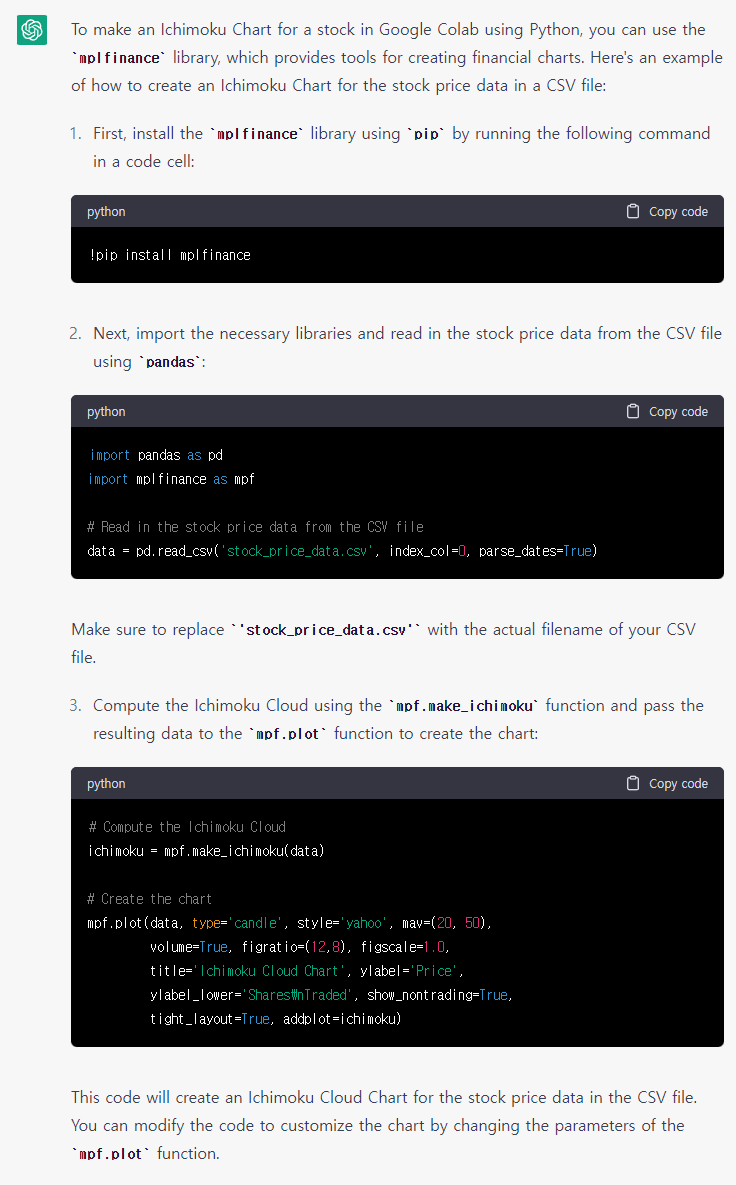
이렇게 답변을 주길래 실행을 해봤는데..
에러가 나네요.ㅋ
아마도 mplfinance 라이브러리가 뭔가 업데이트가 되면서 mpf.make_ichimoku 모듈이 없나봐요.
오늘도 chatGPT한테서 하나 배우고 갑니다.
좋은 하루 되세요~^^
'Programming > Python' 카테고리의 다른 글
| chatGPT 의 내용이 짤릴때??? 전 이렇게 해봤습니다~ (0) | 2023.03.08 |
|---|---|
| 3개이상의 데이터프레임 합치기 merge over 3 dataframes with indicators (0) | 2023.03.03 |
| 로또 번호 생성기 ^^ (feat. chatGPT) (0) | 2023.02.23 |
| 키움 API 실시간 데이터 받은 후 체결창 데이터 시각화 해보기 (0) | 2021.09.11 |
| 파이썬 캘린더 다음달 출력, calendar next month (1) | 2021.09.07 |