파이썬 캔들 차트, plotly-02 #Candlestick Parameters 살펴보기1-decreasing Programming/Python2021. 2. 19. 14:49
[Candlestick Documentation]
plotly.github.io/plotly.py-docs/generated/plotly.graph_objects.Candlestick.html
# 상기 주소로 가서 Candlestick class 의 parameter 을 살펴보면 다양한 종류가 있습니다.
# 이전 살펴보기에서 어떤식으로 간략히 그릴수 있는지 살펴봤었고, x, close, high, open, low 값을 통해 그릴 수 있었습니다.
# 이외에도 다양하게 있는데 하나씩 살펴볼려고 합니다.
* 찾아봐도 모르겠는건 과감히~~^^ pass~~^^;;;;;;;;;;;; 누가 좀 알려주세용~^^
* close – Sets the close values.
# 종가 가격
* closesrc – Sets the source reference on Chart Studio Cloud for close .
# Chart Studio Cloud 에서 어떤 셋팅을 하는 것 같다. 주피터에서는 별다른 작동을 안함.
* customdata – Assigns extra data each datum. This may be useful when listening to hover, click and selection events. Note that, “scatter” traces also appends customdata items in the markers DOM elements
# unknown function ^^;;
* decreasing – plotly.graph_objects.candlestick.Decreasing instance or dict with compatible properties
* class plotly.graph_objects.candlestick.Decreasing(arg=None, fillcolor=None, line=None, **kwargs)
plotly.graph_objects.candlestick package — 4.14.3 documentation
# decreasing 은 캔들에서 떨어가지는 캔들에 대한 fillcolor 와 line 에 대한 정의를 할 수 있습니다.
Bases: plotly.basedatatypes.BaseTraceHierarchyTypeproperty fillcolor
Sets the fill color. Defaults to a half-transparent variant of the line color, marker color, or marker line color, whichever is available.
The ‘fillcolor’ property is a color and may be specified as:
- A hex string (e.g. ‘#ff0000’)
- An rgb/rgba string (e.g. ‘rgb(255,0,0)’)
- An hsl/hsla string (e.g. ‘hsl(0,100%,50%)’)
- An hsv/hsva string (e.g. ‘hsv(0,100%,100%)’)
- A named CSS color:aliceblue, antiquewhite, aqua, aquamarine, azure, beige, bisque, black, blanchedalmond, blue, blueviolet, brown, burlywood, cadetblue, chartreuse, chocolate, coral, cornflowerblue, cornsilk, crimson, cyan, darkblue, darkcyan, darkgoldenrod, darkgray, darkgrey, darkgreen, darkkhaki, darkmagenta, darkolivegreen, darkorange, darkorchid, darkred, darksalmon, darkseagreen, darkslateblue, darkslategray, darkslategrey, darkturquoise, darkviolet, deeppink, deepskyblue, dimgray, dimgrey, dodgerblue, firebrick, floralwhite, forestgreen, fuchsia, gainsboro, ghostwhite, gold, goldenrod, gray, grey, green, greenyellow, honeydew, hotpink, indianred, indigo, ivory, khaki, lavender, lavenderblush, lawngreen, lemonchiffon, lightblue, lightcoral, lightcyan, lightgoldenrodyellow, lightgray, lightgrey, lightgreen, lightpink, lightsalmon, lightseagreen, lightskyblue, lightslategray, lightslategrey, lightsteelblue, lightyellow, lime, limegreen, linen, magenta, maroon, mediumaquamarine, mediumblue, mediumorchid, mediumpurple, mediumseagreen, mediumslateblue, mediumspringgreen, mediumturquoise, mediumvioletred, midnightblue, mintcream, mistyrose, moccasin, navajowhite, navy, oldlace, olive, olivedrab, orange, orangered, orchid, palegoldenrod, palegreen, paleturquoise, palevioletred, papayawhip, peachpuff, peru, pink, plum, powderblue, purple, red, rosybrown, royalblue, rebeccapurple, saddlebrown, salmon, sandybrown, seagreen, seashell, sienna, silver, skyblue, slateblue, slategray, slategrey, snow, springgreen, steelblue, tan, teal, thistle, tomato, turquoise, violet, wheat, white, whitesmoke, yellow, yellowgreen
ReturnsReturn type
property line
The ‘line’ property is an instance of Line that may be specified as:
- An instance of plotly.graph_objects.candlestick.decreasing.Line
- A dict of string/value properties that will be passed to the Line constructorcolorwidth
- Sets the width (in px) of line bounding the box(es).
- Sets the color of line bounding the box(es).
- Supported dict properties:
ReturnsReturn type
plotly.graph_objects.candlestick.decreasing.Line
# 우선 여기서 비교를 위해서 아래와 같이 주피터 노트북으로 간단한 캔들차트를 그려보았습니다.
import plotly.graph_objects as go

fig = go.Figure(data=[go.Candlestick(x=[1, 2, 3, 4, 5],
                open  = [ 1, 6, 7, 10, 5 ],
                close = [ 2, 10, 3, 12, 8  ],
                high  = [ 10, 12, 8, 15, 18 ],
                low   = [ 0.1, 5, 2, 8, 5 ],
                )])

fig.show()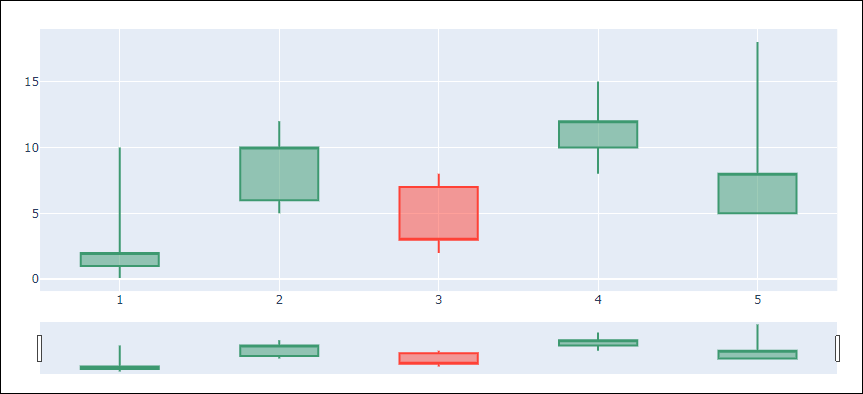
# decreasing 적용을 위해서는 아래와 같이 dict 형태로 묶어서 전달하는 해주면 됩니다.
import plotly.graph_objects as go

fig = go.Figure(data=[go.Candlestick(x=[1, 2, 3, 4, 5],
                open  = [ 1, 6, 7, 10, 5 ],
                close = [ 2, 10, 3, 12, 8  ],
                high  = [ 10, 12, 8, 15, 18 ],
                low   = [ 0.1, 5, 2, 8, 5 ],
                decreasing = dict(fillcolor='blue')
                )])

fig.show()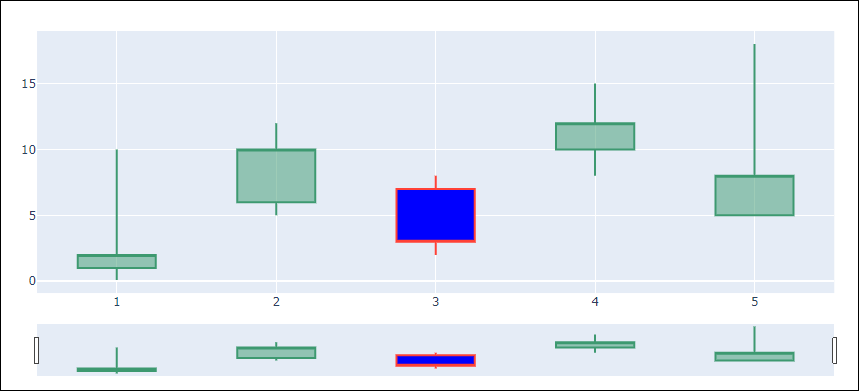
# decreasing 의 fillcolor 는 위의 설명에서 보듯, rgd 코드, css 타입등등으로 넣을 수 있습니다. 전, 익숙한 blue 로 색을 채워보았습니다.
# 선이 아직도 빨간색이라서 선도 파란색으로 넣어 보겠습니다.
# 선 또한 rgb, hex 등등으로 색을 변경할 수 있습니다.
import plotly.graph_objects as go

fig = go.Figure(data=[go.Candlestick(x=[1, 2, 3, 4, 5],
                open  = [ 1, 6, 7, 10, 5 ],
                close = [ 2, 10, 3, 12, 8  ],
                high  = [ 10, 12, 8, 15, 18 ],
                low   = [ 0.1, 5, 2, 8, 5 ],
                decreasing = dict(fillcolor='blue', line=dict(color='blue'))
                )])

fig.show()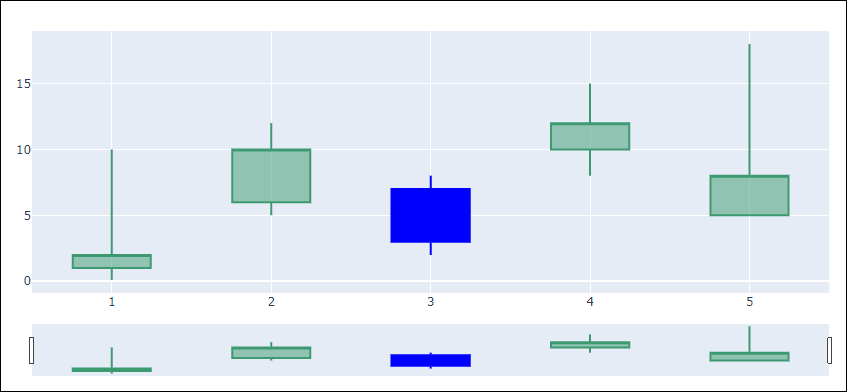
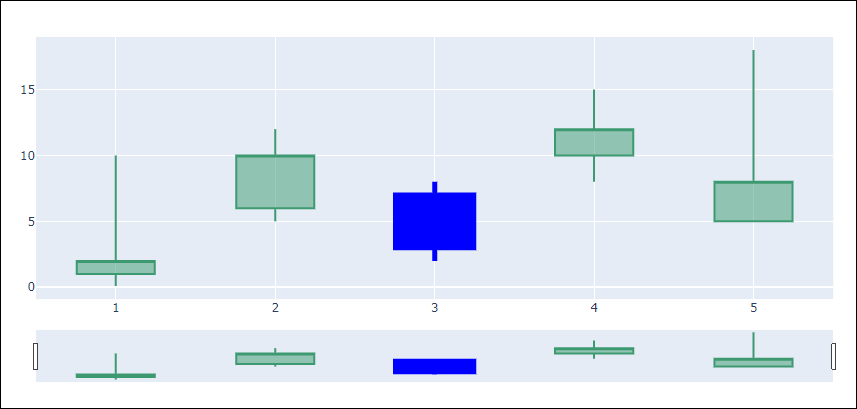
# 선의 굵기도 조정할 수 있습니다.
line=dict(color='blue', width=5)# 5정도로 하면 아래와 같습니다.
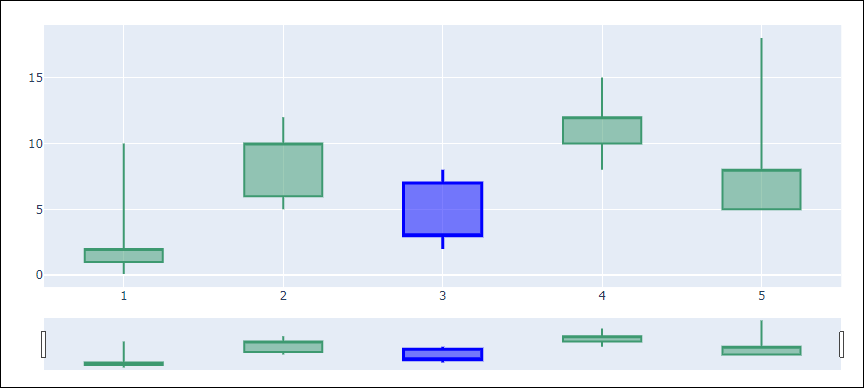
# 여기서 alpha 값을 줘서 파란색을 배경이 보이는 형태로 만들고 싶으면. rgba 를 사용하면됩니다.
# rgb 표 색상은 구글에 검색하시면 엄청 잘 나와있어요~^^
fillcolor='rgba(0,0,255,0.5)'# rgba(red, green, blue, alpha) 값을 나타냅니다. alpha 를 0.5 정도로 적용하면 아래와 같습니다.
# alpha 값은 0.0 (투명) ~ 1.0 (불투명) 으로 보시면 됩니다.
[이전글]
2021/02/16 - [Programming/Python] - plotly-00 #시작
2021/02/17 - [Programming/Python] - plotly-01 #Candlestick Charts 살펴보기
'Programming > Python' 카테고리의 다른 글
| tensorflow 깔아보기 (0) | 2021.05.08 |
|---|---|
| 파이썬 캔들 차트, plotly-03 #Candlestick Parameters 살펴보기2-hoverinfo (0) | 2021.02.24 |
| 파이썬 캔들 차트, plotly-01 #Candlestick Charts 살펴보기 (0) | 2021.02.17 |
| 파이썬 차트, plotly-00 #시작 (0) | 2021.02.16 |
| KRX 회원사별 어디갔니? (0) | 2021.01.19 |


